

Final 2026 Open Enrollment Report: Demographics & Dental Plans (Part 4)
Fri, 03/27/2026 - 4:02pm
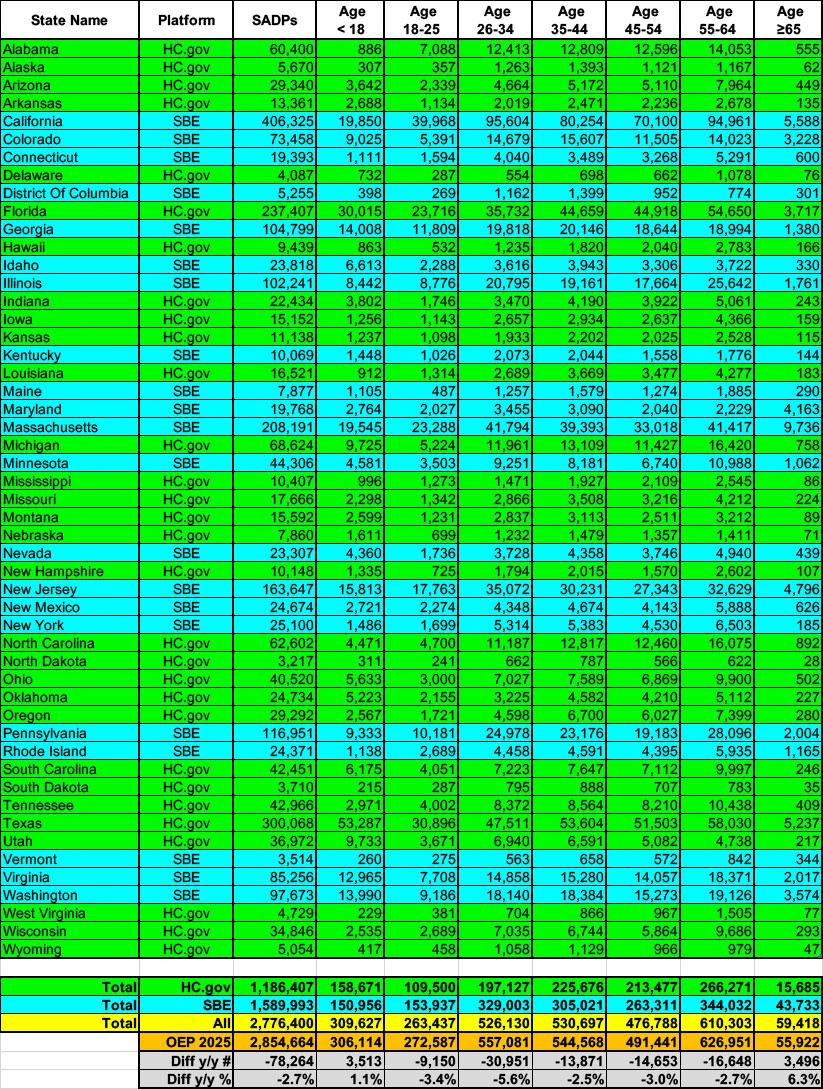
Next up: Age brackets, gender, racial/ethnic groups and urban/rural communities. I'm also throwing in the stand-alone Dental Plan table here for the heck of it since I don't know where else to include it.
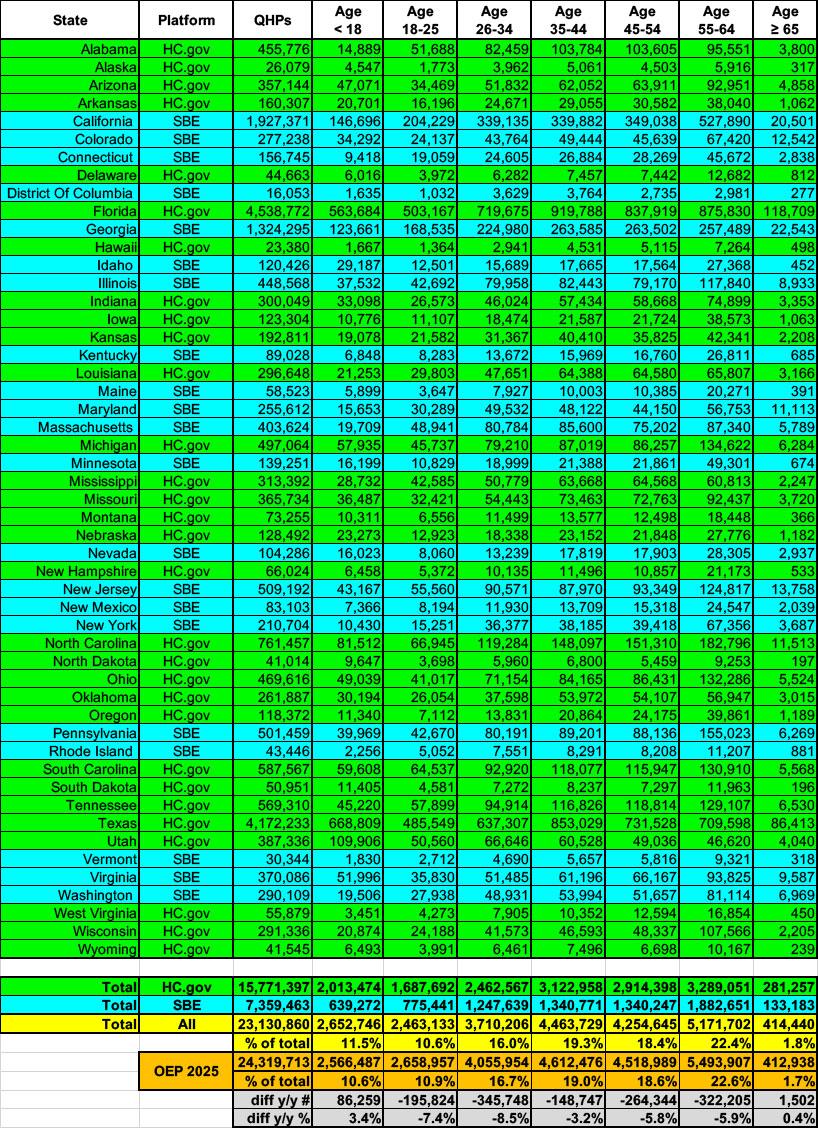
Nationally, there hasn't been that much of a shift in the enrollment breakout by age bracket...but within each bracket there's a couple of takeaways:
- As expected given the subsidy expiration, enrollment among young adults plummeted (down 7.4% & 8.5% among 18-25 yr olds & 26 - 34 yr olds respectively). This will absolutely have a disproportionate negative impact on the risk pool (and, thus, gross premiums) next year
- On the other hand, enrollment of children actually increased by 3.4% year over year, which I wasn't expecting at all.
- I was also surprised to see that enrollment among seniors inched up ever so slightly (about 0.4%, or 1,500 people). Huh.
At the state level:
- Alabama again has the lowest percent of enrollees who are children (just 3.3%) while Utah again has the highest (28.4%), which I guess makes sense since Utah has the youngest median-aged population in the country.
- At the opposite end, the Dakotas have the lowest percent of seniors enrolled in ACA plans (0.4% & 0.5% respectively) while Florida & Texas have the highest (2.6% & 2.1%).
I'm not bothering posting a gender breakout as it doesn't vary that much from state to state; it ranges from a 43/57% male/female split in Rhode Island to a 51/49% split in Missouri. Nationally it's 48% male, 52% female.
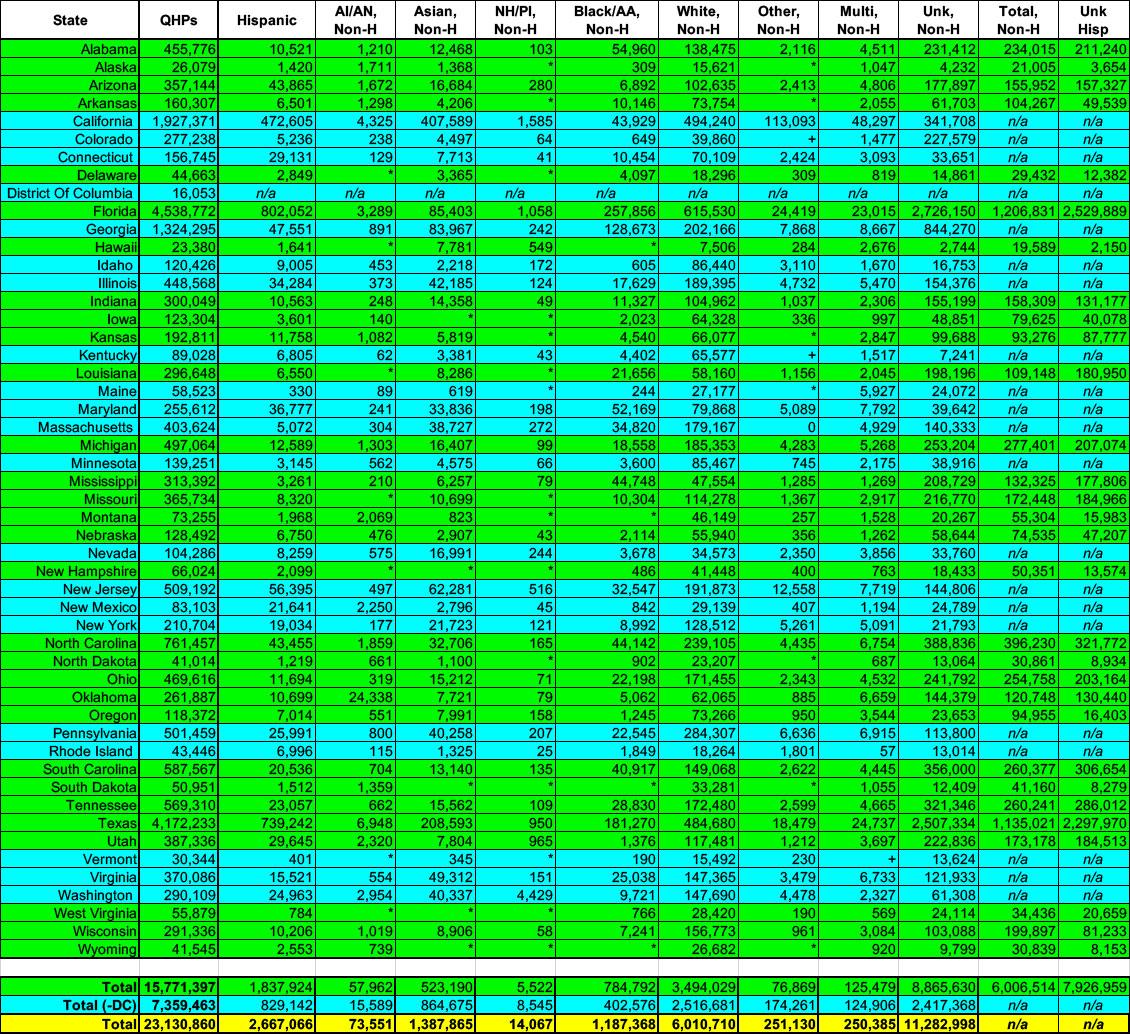
The Hispanic/Non-Hispanic and Rural/Urban data isn't terribly useful at the national level since some of it isn't reported for any of the state-based exchanges, and even for the racial breakout, fully 50% of all enrollees are listed as "Unknown, Non-Hispanic" which kind of limits any conclusions you might take from any of it.
What is interesting, however, is that the Trump Regime is still including the racial/ethnic demographic data at all, which is a bit surprising given that they've been purging this type of so-called "woke" data from every other federal healthcare database. Huh. Glad to see it (for now, at least).
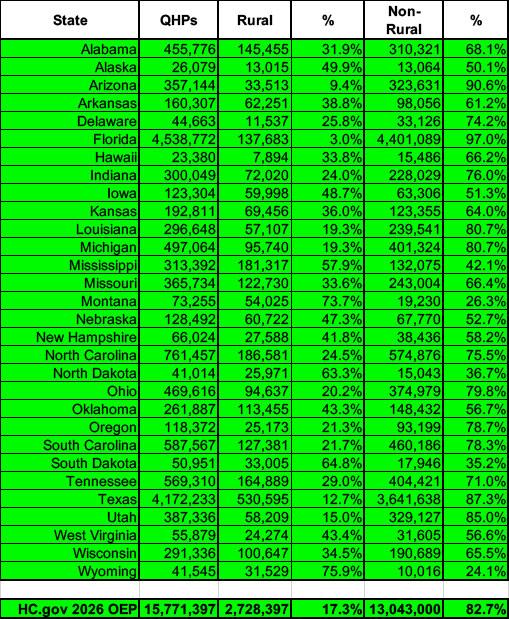
The CMS Public Use File does break out "Rural" vs. "Non-Rural" enrollment for the 30 HealthCare.Gov states...Florida has the lowest percent of rural enrollment at just 3%, while Wyoming (understandably) has the highest, at 76% of all enrollees.
2.78 million Americans selected standalone dental policies during Open Enrollment this year, down 2.7% (78,000) from OEP 2025. Interestingly, again, stand-alone dental plan enrollment was actually up slightly for children as well as increasing significantly for seniors (up 6.3% or around 3,500 enrollees). Huh.
Advertisement
