

Arkansas: Effectuated enrollment down "only" 5.2% y/y thanks to robust Premium Alignment
Thu, 05/21/2026 - 8:38pm
Here's some more Arkansas data on top of yesterday's analysis of premium & out of pocket cost increases.
Once again: The true measure of ACA healthcare coverage enrollment isn't how many people select policies during the Open Enrollment Period, it's how many actually have those policies in effect (aka "effectuated enrollment")...as well as how comprehensive that coverage is, of course.
Yesterday, Pluribus News published a new story about effectuated enrollment across a dozen or so states (the reporters actually consulted with me several times about their data and how to present it, although I somehow didn't end up getting credited in the final version).
In any event, most of the material discussed in their story is pretty much everything I've been writing about and warning about for months, and even the enrollment data they acquired is the same as what I have in most cases. They were, however, able to get ahold of hard effectuation numbers for three states which I didn't already know: Arkansas, Nevada and Vermont.
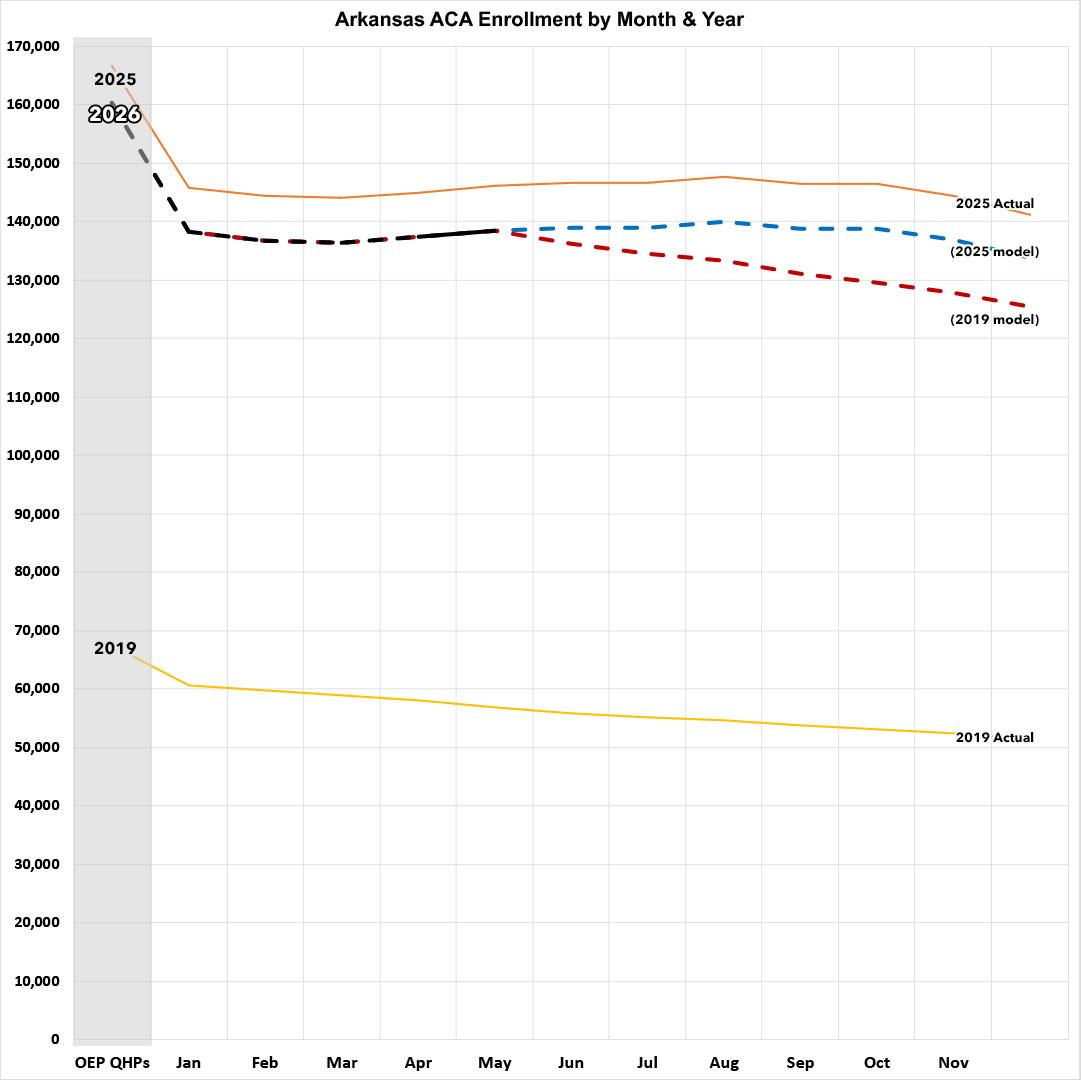
With that in mind, here's what Arkansas' enrollment looks like as of May compared compared with the official CMS monthly effectuated reports from prior years. It's important to note that the Pluribus story only has the effectuated number for May, so I'm assuming it was proportionately similar for January - April:
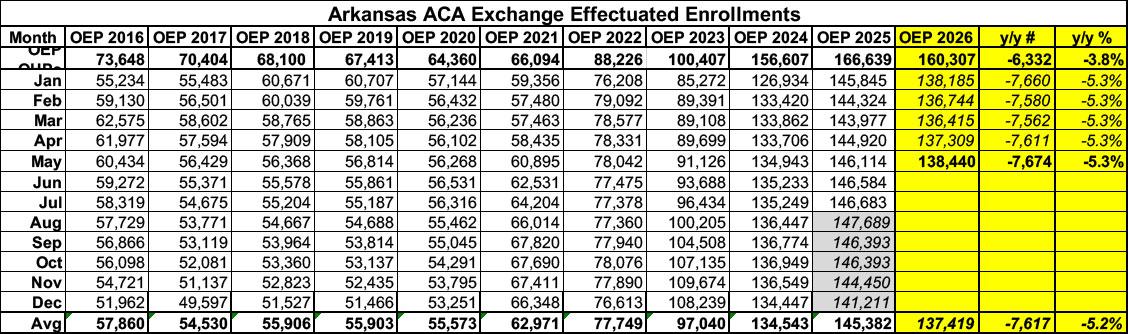
I was actually a bit surprised that Arkansas was able to provide actual enrollment data at all since they're not a state-based ACA exchange...although they're technically a state exchange using the federal platform (SBM-FP). This means they're still hosted on HealthCare.Gov but they do have their own legal/governmental entity), as are Oregon and Oklahoma at the moment...which I presume means that they have access to ACA enrollment data that most federally-facilitated exchange states don't.
As of May, Arkansas effectuated enrollment stands at 138,440 people, down around 5.2% vs the same point a year earlier. This is actually a fairly modest decline compared to most states, and I'm pretty sure the main reason for this is that Arkansas is one of three states (along with Illinois and Washington) which has newly-implemented robust Premium Alignment pricing to help cut down premiums for tens of thousands of enrollees.
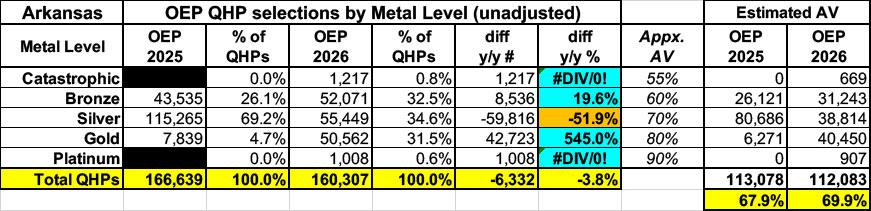
As I noted yesterday, you can see this in the metal level breakout, which shows a massive shift away from Silver plans into Gold plans, which more than quintripled in enrollment:
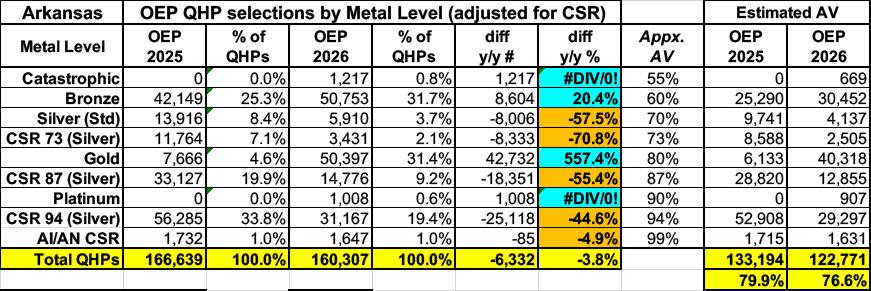
Of course as I also noted yesterday, when you further break things out by CSR category, it's not quite as rosy...a big chunk of those moving to Gold did so by dropping their high CSR Silver, meaning they actually lost value (although this was necessary in order to save on premiums):
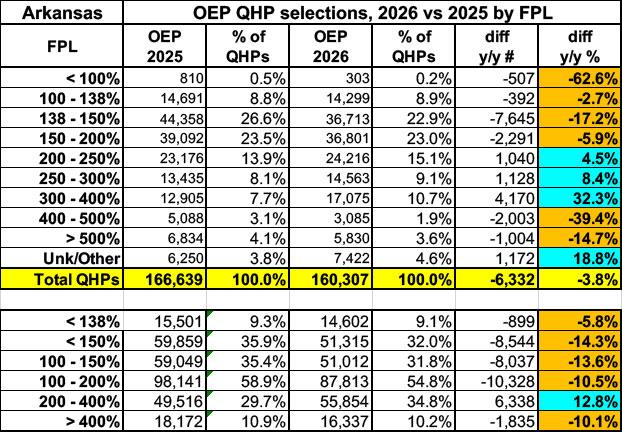
Here's the breakout by income bracket. As with most other states, enrollment below the poverty line (which was always nominal to begin with) dwindled to almost nothing, and enrollment in most other income brackets also plummeted...except for the 200 - 400% range, which actually saw a significant increase, especially from 300 - 400% FPL. As I've stated before, I'm pretty sure that what's actually happening there is largely households who normally earn slightly more than 400% FPL projecting a < 400% income in order to avoid falling off the Subsidy Cliff...and who are now scrambling to make sure they don't go over the subsidy cut-off threshold:
Here's what effectuated enrollment will look like for the rest of the year in Arkansas assuming it follows either the 2025 or 2019 patterns:
- If the rest of the year follows the 2025 pattern, effectuations will end December at around 134,000 and will average around 137,000 for the year...down 5.3% compared to 2025.
- If the rest of the year follows the 2019 pattern, effectuations will be at around 125,000 by December, and the average for the year will be around 133,000...down 8% y/y. That would mean around 12,000 fewer people having ACA healthcare coverage than last year.
Here's where things stand so far...
- Arkansas: OEP down 3.8%; May effectuations down 5.3%
- California: OEP down 2.6%; February effectuations down 8.5%
- Colorado: OEP down 1.9%; March effectuations down 6.1%
- Georgia: OEP down 12.3%; April effectuations down 28.1%
- Maryland: OEP up 3.4%; April effectuations down 6.3%
- Massachusetts: OEP up 3.7%; April effectuations down 4.3%
- Minnesota: OEP down 8.1%; February effectuations down 8.6%
- New Jersey: OEP down 0.8%; April effectuations down 11.6%
- New Mexico: OEP up 18.1%; May effectuations up 5.6%
- New York: OEP down 4.9%; May effectuations down 8.7%
- Pennsylvania: OEP up 1%; May effectuations down 5.2%
- Washington: OEP down 5.9%; February effectuations down 15.7%
In terms of year over year average monthly effectuated enrollment as of the months of the latest data:
- Arkansas: Down ~7,700
- California: Down ~110,000
- Colorado: Down ~13,400
- Georgia: Down ~370,000
- Maryland: Up ~7,000
- Massachusetts: Up ~1,600
- Minnesota: Down ~10,000
- New Jersey: Down ~57,000
- New York: Down ~14,500
- New Mexico: Up ~7,200
- Pennsylvania: Down ~2,300
- Washington: Down ~33,000
- Total across 12 states: Down at least ~602,000
Advertisement
